
sql-explainerator
sql-explainerator converts query execution plans ( the output from an ‘EXPLAIN’ statement ) into pretty diagrams
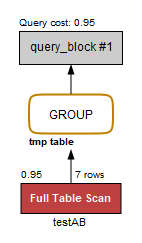
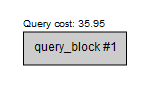
It attempts to recreate the type of diagrams you get from the ‘visual explain’ pane in MySQL Workbench, and looks like this:
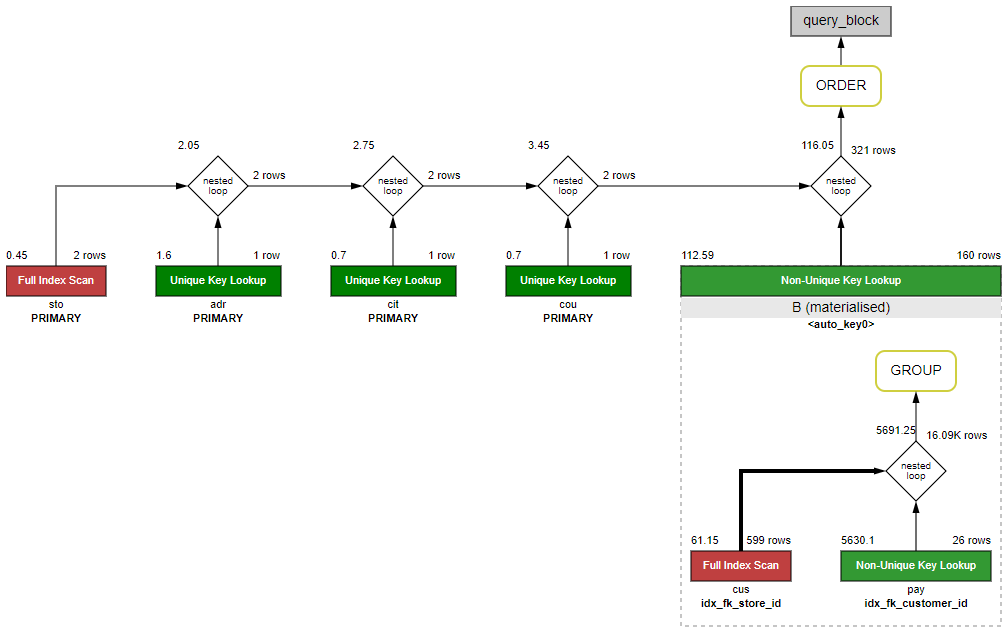
The images are SVG, although you can also generate HTML output which wraps the SVG.
Why would anyone want to do that ?
Because diagrams are easier to comprehend than the tabular or JSON ‘explain’ output you get in MySQL.
And becaue it’s in java, so I might be able to hook it into a running app server to generate these things on the fly rather than having to start up MySQL Workbench and cut and paste SQL across in order to click the explain query button on that.
And, of course, because I’m a man, and apparently I live for explaining things.
Can I see some pictures ?
Sure.
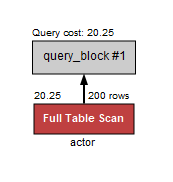
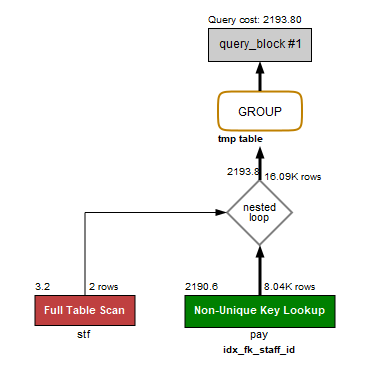
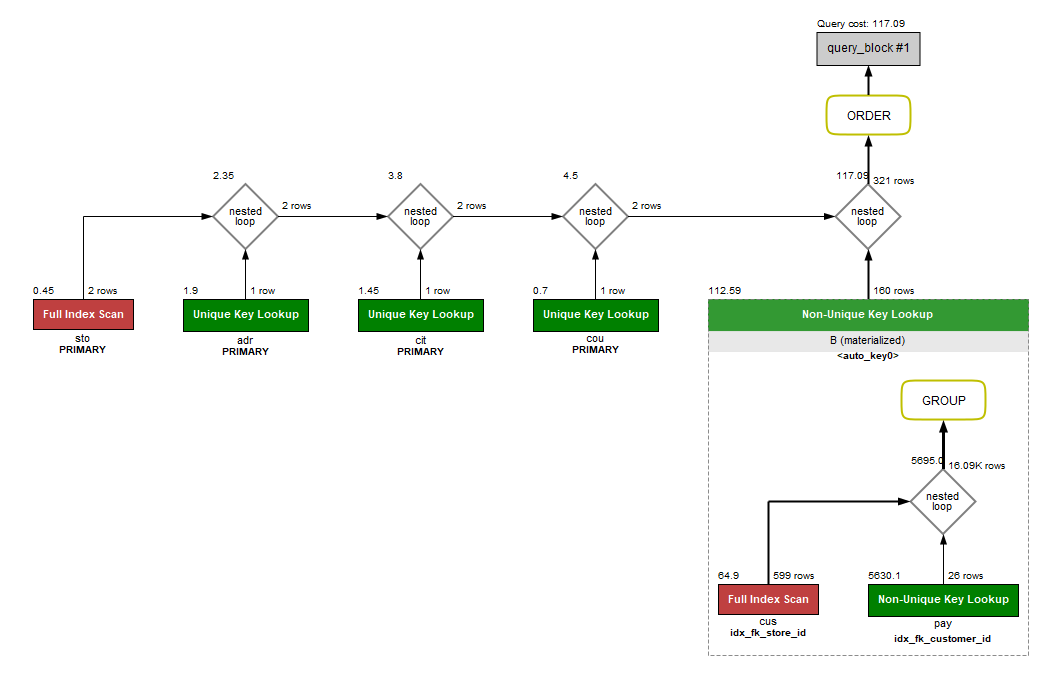
Here’s some examples of the sort of output it generates.
Both the SVG and HTML contain javascript to display the tooltips, but you can produce output without the javascript, if that’s your bag.
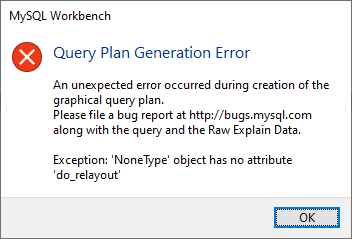
The Workbench output is for comparison, and was created by taking some screenshots of Workbench 8.0.30 running against MySQL Server 8.0.27, both on Windows. The :poop: symbol represents particularly shithouse output.
| Name | Output
HTML | Output
SVG | Input
SQL | Input
JSON | Workbench
Comparison | Blurb | |–|:–:|:–:|:–:|:–:|:–:|–| | sakila-1 | HTML | SVG | SQL | JSON | PNG | simple SELECT | | sakila-4a | HTML | SVG | SQL | JSON | PNG | grouping, ordering | | sakila-6a | HTML | SVG | SQL | JSON | PNG | joined tables | | sakila-6b | HTML | SVG | SQL | JSON | PNG | joined tables, grouping | | sakila-7g | HTML | SVG | SQL | JSON | PNG | joined subqueries | | having-1 | HTML | SVG | SQL | JSON | PNG :poop: | group by, having subquery | | having-2 | HTML | SVG | SQL | JSON | PNG :poop: | subquery + having subquery | | insert-1 | HTML | SVG | SQL | JSON | PNG :poop: | insert into | | window-1 | HTML | SVG | SQL | JSON | PNG :poop: | window function | | window-3 | HTML | SVG | SQL | JSON | PNG :poop: | grouped window function | | window-4 | HTML | SVG | SQL | JSON | PNG :poop: | named windows, subqueries | | window-5 | HTML | SVG | SQL | JSON | PNG :poop: :poop: | window partitions |
How do I use it ?
If you’re running this from Java code, take a look at the SimpleTest
If you’re running this from the command-line:
C:\util\java> java -jar sql-explainerator-0.0.3-cli.jar --help
usage: SqlExplaineratorCli [options]
 -h,--help                  This usage text
 -i,--infile <infile>       input file, or '-' for stdin; default = stdin
 -o,--outfile <outfile>     output file, or '-' for stdout; default = stdout
 -l,--layout <layout>       layout format (workbench or explainerator); default = explainerator
 -f,--format <format>       output format (svg or html); default = svg
 -t,--tooltip <tooltip>     tooltip type (none, title, attribute, javascript); default = title
 -j,--jdbc <jdbc>           JDBC connection string
 -u,--username <username>   JDBC username
 -p,--password <password>   JDBC password
 -d,--driver <driver>       JDBC driver class name; default = org.mariadb.jdbc.Driver
 -q,--sql <sql>             SQL to explain
 -c,--css <css>             alternate css file
 -s,--script <script>       alternate javascript file

This command will convert a MySQL JSON execution plan into an SVG diagram.
There are two layout methods: 'workbench' which will try to mimic the diagrams generated from MySQL
Workbench, or 'explainerator', which adds support for inserts, 'having' clauses, and window functions.

The execution plan can be supplied via stdin or --infile (Example 1), or can be retrieved from a
MySQL server (Example 2).

Example 1: To generate the query plan JSON, execute an 'EXPLAIN FORMAT=JSON' statement:

  mysql --user=root --password=abc123 --silent --raw --skip-column-names \
    --execute "EXPLAIN FORMAT=JSON SELECT 1 FROM DUAL" sakila > plan.json

then to generate the SVG diagram, supply this JSON as input to SqlExplaineratorCli:

  SqlExplaineratorCli --infile plan.json --outfile plan.svg
or
  cat plan.json | SqlPlainToImageCli > plan.svg


Example 2: To generate the diagram from an SQL statement, you will need to also supply a JDBC
connection string and any credentials required to connect, e.g.:

  SqlExplaineratorCli --jdbc jdbc:mysql://localhost/sakila --username root --password abc123 \
    --sql "SELECT 1 fROM DUAL" --outfile plan.svg
And some example command-lines (new-lines added for readability):
C:\util\java> java -jar sql-explainerator-0.0.3-SNAPSHOT-cli.jar
  --jdbc jdbc:mysql://localhost/sakila --username root --password abc123
  --sql "SELECT 1 fROM DUAL" --outfile plan.svg
C:\util\java>"c:\Program Files\MySQL\MySQL Server 8.0\bin\mysql"
  --user=root --password=abc123 --silent --raw --skip-column-names
  --execute "EXPLAIN FORMAT=JSON SELECT 1 FROM DUAL" sakila > plan.json

C:\util\java>java -jar sql-explainerator-0.0.3-SNAPSHOT-cli.jar
  --infile plan.json --outfile plan.svg
Where can I get it ?
It’s available in maven with the groupId:artifactId of com.randomnoun.db:sql-explainerator.
There’s a sql-explainerator-0.0.3-cli.jar which has all the maven dependencies baked in if you’re calling this from a CLI.
You can add it to your pom.xml using the snippet:
<dependency>
  <groupId>com.randomnoun.db</groupId>
  <artifactId>sql-explainerator</artifactId>
  <version>0.0.3</version>
</dependency>
but maybe check what the latest version is up on central.
What databases can I run this on ?
MySQL
Doesn’t this already exist ?
Well, MySQL Workbench exists, but that’s not so easy to use from within a webapp.
But yes, you’d imagine this would already exist somewhere, wouldn’t you.
Don’t you normally crap on about your git projects on the blog ?
Further reading
- MariaDB EXPLAIN is not MySQL EXPLAIN: https://mariadb.com/kb/en/explain-format-json-differences/
- More of that: https://mariadb.com/kb/en/differences-between-the-mysql-and-mariadb-query-optimizer/
- More MariaDB EXPLAIN things: https://mariadb.com/kb/en/explain-format-json/
- More MariaDB EXPLAIN things, in blog form: https://web.archive.org/web/20200218115814/http://s.petrunia.net/blog/?p=93
- A not very useful EXPLAIN visualiser project: https://github.com/Preetam/explain-analyzer
- Some EXPLAIN JSON tests from the mysql-server source: https://github.com/mysql/mysql-server/blob/8d8c986e5716e38cb776b627a8eee9e92241b4ce/mysql-test/r/window_std_var_optimized.result
- Some more of those: https://github.com/mysql/mysql-server/search?p=2&q=ordering_operation
Licensing
sql-explainerator is licensed under the BSD 2-clause license.